Appearance
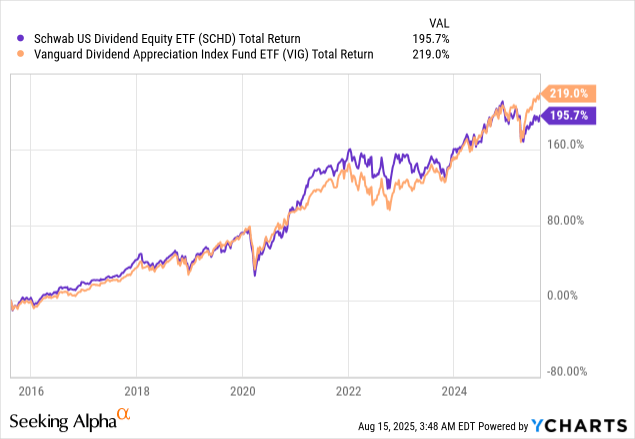
SCHD vs VIG
Total Return
Industry Exposure
| Industry | VIG (%) | SCHD (%) |
|---|---|---|
| Information Technology | 26.60% | 9.00% |
| Financials | 22.50% | 8.91% |
| Health Care | 14.60% | 15.53% |
| Industrials | 11.60% | 12.50% |
| Consumer Staples | 10.10% | 18.81% |
| Consumer Discretionary | 5.30% | 8.38% |
| Materials | 3.20% | 3.07% |
| Energy | 2.80% | 19.23% |
| Utilities | 2.70% | 0.04% |
| Communication Services | 0.60% | 4.52% |
Equity Exposure
| Industry | VIG (%) | SCHD (%) |
|---|---|---|
| Broadcom Inc. | 6.01% | |
| Microsoft Corp. | 5.20% | |
| JPMorgan Chase & Co. | 4.07% | |
| Apple Inc. | 3.42% | |
| Eli Lilly & Co. | 2.85% | |
| Visa Inc. Class A | 2.70% | |
| Exxon Mobil Corp. | 2.38% | |
| Mastercard Inc. Class A | 2.27% | |
| Walmart Inc. | 2.08% | |
| Costco Wholesale Corp | 2.04% | |
| Chevron Corp. | 4.32% | |
| PepsiCo Inc. | 4.31% | |
| ConocoPhillips | 4.25% | |
| Altria Group Inc. | 4.20% | |
| Home Depot Inc. | 4.16% | |
| Cisco Systems Inc. | 4.16% | |
| AbbVie Inc. | 4.09% | |
| Merck & Co. Inc. | 4.02% | |
| Texas Instruments Inc. | 3.86% | |
| Verizon Communications Inc. | 3.85% | |
| Total | 33.02% | 41.22% |
Performance
| Metric | VIG | SCHD |
|---|---|---|
| AUM | $78.7 | $56.0 |
| YTD CAGR | 7.87% | 5.54% |
| 1Y CAGR | 12.89% | 9.48% |
| 3Y CAGR | 6.33% | 4.63% |
| 5Y CAGR | 11.65% | 12.67% |
| 10Y CAGR | 11.50% | 11.30% |
Dividends
| Metric | VIG | SCHD |
|---|---|---|
| Dividend Yield | 1.68% | 3.75% |
| 3Y DGR | 8.1% | 21.7% |
| 5Y DGR | 39.5% | 70.0% |
| 10Y DGR | 82.3% | 174.0% |